Carbon Capture PROCESSES
Let’s calculate the cost for your different options
PROCESs DESIGN
Let’s solve the energy and mass balances for your process based on our extensive libary of pre-defined functions
DATA ANALYSIS
Tired of spreadsheets? Let’s help to visualize and analyze your data based on the power of Matlab
SOx scrubbers
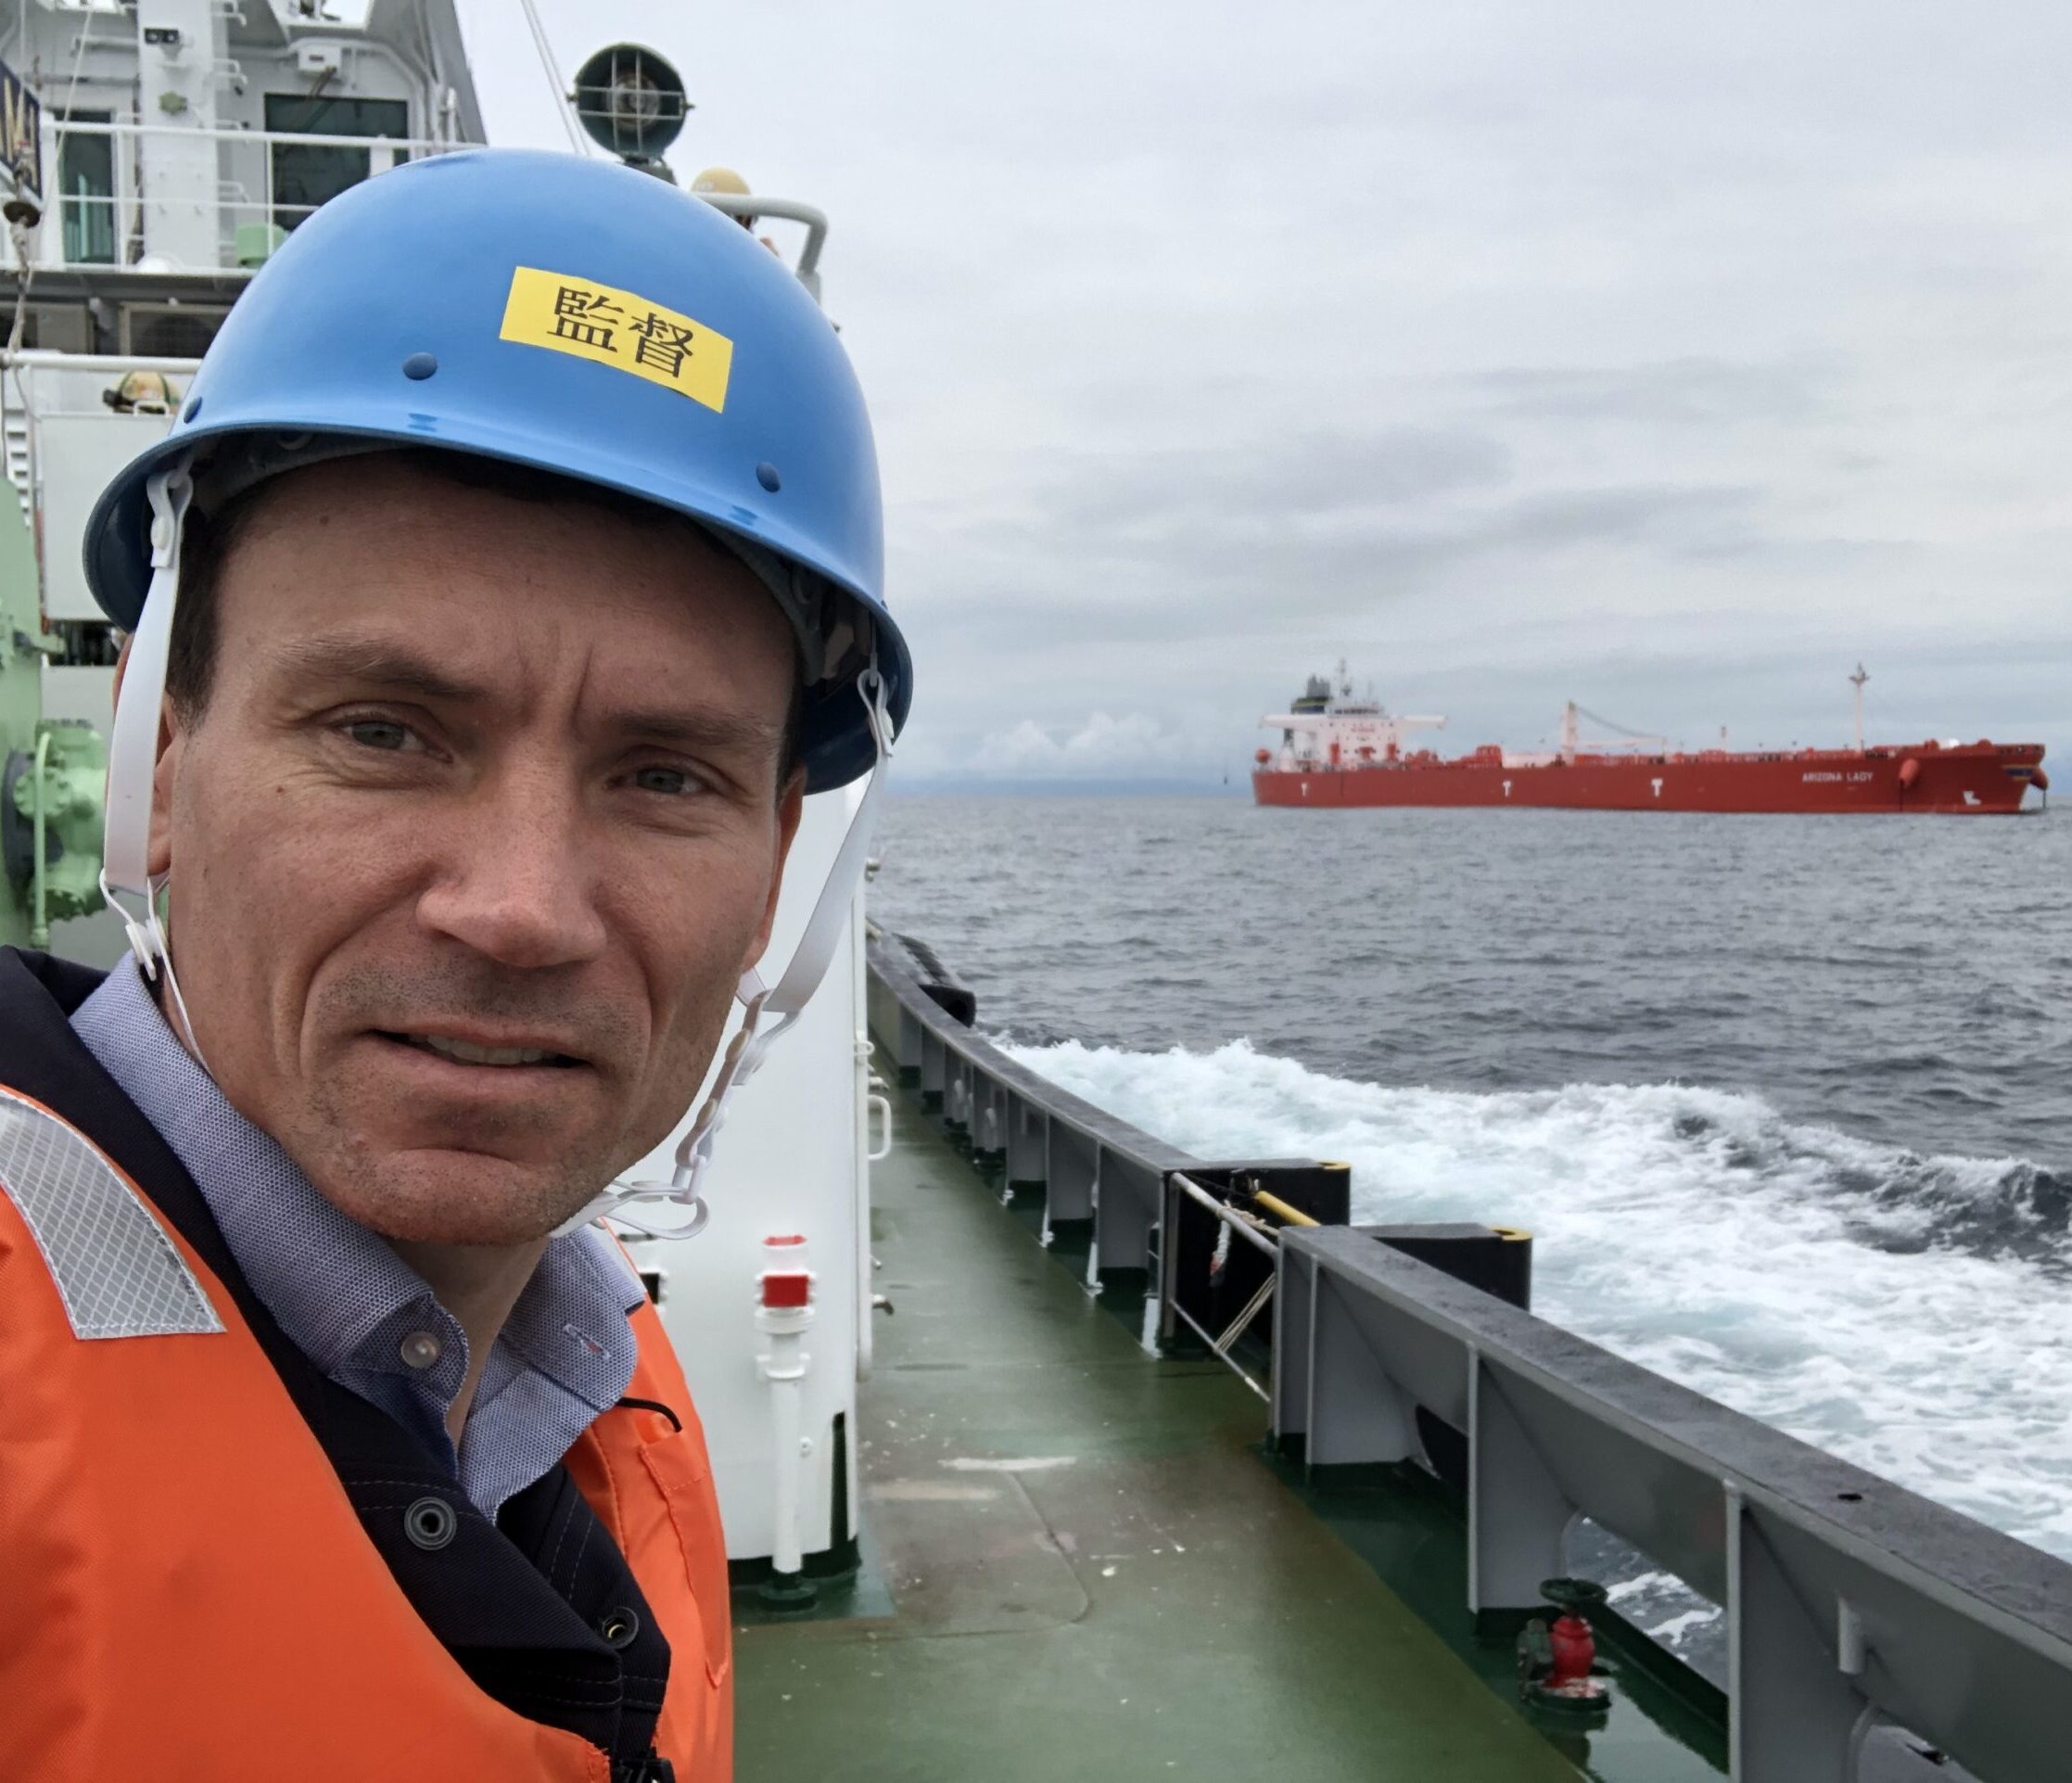
More than 15 years of extensive experience with marine scrubbers
Desalination
In combination with carbon capture processes
Process Simulations
We can model almost any processes by combining our pre-defined functions for combustion, heat exchangers, chemical reactors, pumps, fans, separators, scrubbers, etc.
Amine Process for Carbon Capture
Our model is based on the reaction kinetics of the MEA-H2O-CO2 liquid-gas system. The model can help to optimize the dimensions of the towers, pumps and heat exchangers to meet lowest investment and operating expenses. It can also be used to simulate different scenarios – eg. the impact of varying energy costs and CO2 removal demands
Cement Kiln Systems
Our model solves the energy and mass balances for a rotary kiln , calciner and a cyclone preheater tower. The model allows variations of fuel types, heat losses, number of cyclone stages, cyclone efficiencies ao. Together with the amine scrubber model, it can be used to calculate the cost for Carbon Capture after a cement production process.
SOx Scrubbers
Our SOx scrubber model is based on the reaction kinetics of the H2O-SO2-CO2 liquid-gas system. The model can help to optimize the water flow and dosing of possible alkaline chemicals. It has also been used to optimize the sprayers and filling elements inside different scrubbers.
Compression and Liquefaction of CO2
The electrical power required for compression and liquefaction is important for the entire carbon capture and storage economy. We apply the most precise and proven termodynamic models (Peng Robinson, UNIFAC) and data from REFPROP. We can investigate the impact of the most common impurities in the captured CO2.
Data analysis
Modern control systems usually log all essential process parameters like temperatures, pressures and gas measurements. These data are very valuable for fine tuning the model parameters and hence for optimization of the process. We use Matlabs very powerfull tools to perform the steps below:
#BIG data, #IoT, #AI
Step 1: Import
A script is generated to automatically read the data from a data logger or a PLC. All common formats are accepted and data from different sources (with different time stamps) can easily be aligned (necessary for further calculations)
Step 3: Calculating
Additional data columns are often calculated by providing the measured data as input to the model. This can for example be a calculated energy consumption which can be compared to the actual energy consumption. The differences can be used for model validation or for a second data filtering.
Step 2: Filtering
Some sensors are often malfunctioning and thereby providing unrealistic data. These data are filtered out by simple min and max criterias but more advanced methods like AI or FFT can also be used.
Step 4: Vizualisation and reporting
The data are usually vizulized on a full-screen and exported in a file format (png) so they can be viewed on any PC, browser or mobile phone.
Some key performance indicators (KPI) are sometimes defined and reported on a montly or yearly basis.
Once setup, the above steps can run automatically so the finals results always can be accessed online.
Example of analyzing data from operation of 3 scrubbers for half a year operation
Contact

Jens Peter Hansen
PhD., Chem. Eng.
+45 24597150
jph@ecaengineering.dk
ECA engineering Aps
Kong Eriks Vej 5
9000 Aalborg
Denmark
CVR 39177706
